

This article takes the diagram of the reverse osmosis RO plant as the main thread, gradually analyzing each link from water intake to terminal effluent, key equipment, control strategies, as well as common faults and maintenance methods. It is suitable for engineering designers, equipment purchasers, operation and maintenance technicians, and readers who wish to gain a deeper understanding of the RO plant. The article also provides key points for diagram design, suggestions for automated monitoring, CIP cleaning procedures, and typical case analysis, helping you establish a complete cognitive system for the RO system.
Preface Reverse osmosis technology has become a mainstream solution for industrial and domestic water production due to its efficient desalination capacity and wide applicability. Presenting the RO system in a flowchart format allows for intuitive identification of water flow paths, core equipment locations, and monitoring points, facilitating system design, operation and commissioning, as well as fault diagnosis. This article centers around a standard RO system flowchart, deeply analyzing the functions and design points of each node, and provides optimization and maintenance suggestions based on practical experience.
Overview of the Reverse Osmosis System Process Flow Diagram
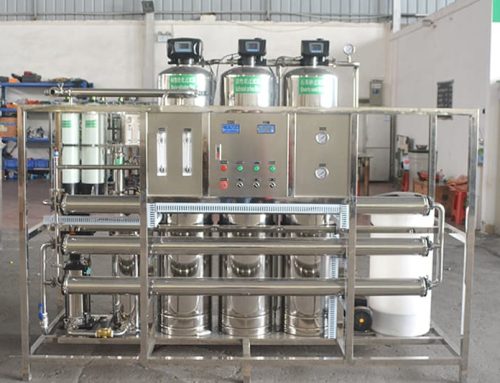
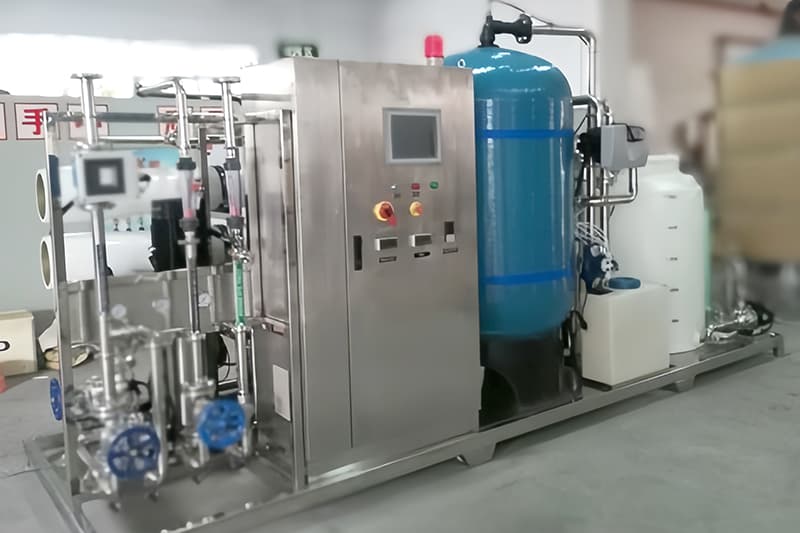
The process of the reverse osmosis plant can be summarized into three stages: pretreatment → reverse osmosis membrane separation → post-treatment.
- Pre-treatment stage: The raw water passes through a quartz sand filter (to remove suspended solids and colloids), an activated carbon filter (to adsorb residual chlorine and organic matter), a softener (to reduce hardness), and a precision filter (to intercept particles >5μm) in sequence, ensuring that the inlet water turbidity is <1 NTU and residual chlorine is <0.1 mg/L, meeting the inlet requirements for RO membranes.
- Membrane separation stage: The high-pressure pump pressurizes the pretreated water to 1.0–1.5 MPa (for brackish water) or 5.5–8 MPa (for seawater), pushing water molecules through the RO membrane to generate pure water (product water) and concentrated wastewater.
- Post-treatment stage: Depending on the requirements, ultraviolet (UV) sterilization, electro-deionization (EDI), or mineralization devices can be added to further enhance water quality. Simplified representation of flowchart: Raw water → Raw water tank → Booster pump → Multi-media filter → Activated carbon filter → Softener → Precision filter → High-pressure pump → RO membrane → Pure water tank → Post-treatment device → Water point.

| Component Name | Function | Technical Parameters | Common Types |
|---|---|---|---|
| Membran RO | Desalination core, pore size 0.0001μm (0.1nm) | Desalination rate ≥98%, operating pressure 0.5–2 MPa | Rolled composite membrane, cellulose acetate membrane |
| High-pressure pump | Provides the pressure required for membrane separation | Efficiency 83–85%, pressure adjusted according to water source (brackish water 1–2 MPa) | Multi-stage centrifugal pump, vertical high-pressure pump |
| Pre-treatment Filter | Protects RO membrane from contamination | Quartz sand filter with turbidity removal rate >90%, activated carbon with residual chlorine adsorption rate >95% | Quartz sand, granular activated carbon, PP melt-blown filter cartridge |
| Post-treatment module | Deep purification of water quality | EDI produced water resistivity ≥15 MΩ·cm, UV sterilization rate >99.9% | EDI device, UV lamp, mineralization filter cartridge |
Principles of Reverse Osmosis Membrane Technology
- Natural infiltration and reverse infiltration:
- Natural infiltration refers to the flow of water molecules from a low-concentration solution through a semipermeable membrane to a high-concentration solution.
- Reverse osmosis achieves salt retention by applying an external pressure (such as 5.5–8 MPa for seawater desalination) higher than the osmotic pressure, causing water molecules to flow in the opposite direction.
- Membrane separation mechanism:
- Screening effect: The pore size of the RO membrane allows only water molecules (approximately 0.3nm) to pass through, while ions and bacteria (with sizes >100nm) are retained.
- Solution-diffusion model: Water molecules first dissolve in the membrane material and then diffuse to the other side under pressure.
- Factors affecting performance:
- Inlet water quality: The optimal operating conditions are a pH range of 3–10 and a temperature of 20–30℃.
- Pollution control: SDI (pollution index) <4, with regular chemical cleaning to prevent membrane scaling.
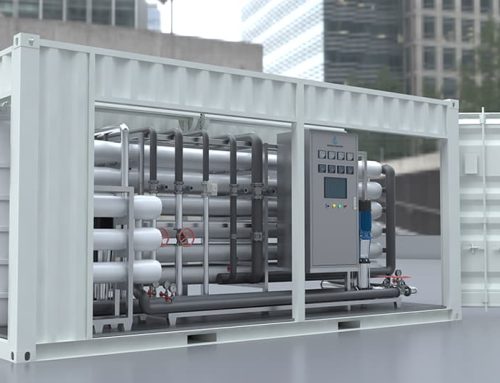
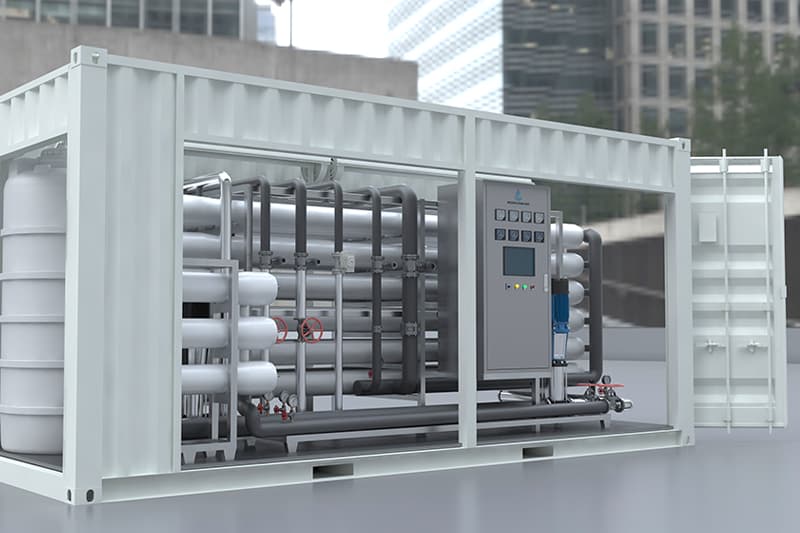
3D CAD module

Detailed Explanation of Preprocessing of the Reverse Osmosis Plant Diagram
Pre-treatment is crucial for protecting the performance and extending the lifespan of RO membranes. Common modules include:
- Grating/screen: removes large particles and debris to protect downstream equipment.
- Sand filtration (or multi-media filtration): removes suspended solids and turbidity, and reduces SDI (specific dirt index).
- Activated carbon adsorption: removes residual chlorine, organic matter, and odors, preventing membrane oxidation.
- Softening or ion exchange (optional): When the raw water has high hardness, softening or adding scale inhibitors can reduce the risk of carbonate/sulfate scaling.
- Precision filter element (5μm→1μm→0.5μm, etc.): The final particle interception, protecting the membrane components from particulate damage.
- Design essentials: Determine the pretreatment level based on the SDI, turbidity, hardness, and organic matter content of the raw water; specify the sequence of each filtration unit, switching valves, and backwash circuits in the flowchart.
High-pressure pump and energy consumption optimization of the Reverse Osmosis Plant Diagram
The high-pressure pump is responsible for providing the necessary net driving force (transmembrane pressure) for the RO membrane. Factors to consider when selecting a model include flow rate, required pressure, pump efficiency, and corrosion resistance. Energy consumption accounts for the majority of the operating costs of the RO system, and common optimization methods include:
- Selecting an efficient variable frequency drive (VFD) to achieve working condition adjustment;
- Employing energy recovery devices (particularly crucial in high-concentration seawater or high-recovery systems);
- Optimize membrane stage configuration (in series and parallel combinations) to reduce operating pressure. In the flowchart, indicate the bypass of the pump, suction filter, pressure gauge, and safety valve for ease of maintenance and protection.
RO membrane and flow path design of the Reverse Osmosis Plant Diagram
Ro membrane are typically installed inside pressure vessels (Vessels) and combined in series or parallel configurations to meet the requirements for desalination rate and water production volume. The flow diagram should indicate the orientation of the membrane housing, as well as the locations of the permeate outlet and the concentrate outlet. Design considerations include:
- The arrangement of membrane components affects recovery rate and desalination effect. Series connection increases desalination rate, while parallel connection improves water production;
- Control the recovery rate to avoid scaling caused by excessively high recovery rate or energy waste caused by excessively low recovery rate;
- Temperature and influent TDS are important parameters that determine operating pressure. Sampling points, online conductivity meters (Permeate and Concentrate), and membrane housing pressure monitoring points should be marked in the diagram for real-time evaluation of membrane module performance.
Post-treatment and storage of permeate water
The permeated water typically requires further treatment to meet the end-use water standards, including mineralization adjustment, pH adjustment, UV disinfection, and cartridge filtration (0.2μm), among others. The right end of the flowchart should be connected to the permeated water storage tank, tank level control, reflux pump, and end distribution system. It is recommended to install automatic flushing and periodic disinfection interfaces at the inlet and outlet of the storage tank to prevent secondary pollution.
Instrumentation and Automation Control of the Reverse Osmosis Plant Diagram
Key monitoring points include pressure gauges for inlet water, membrane housing, and permeate outlet, flowmeters (for inlet water, permeate, and concentrate), thermometers, conductivity/TDS meters, SDI monitoring, and online residual chlorine detection. It is recommended to adopt PLC or DCS integrated control, configured with the following logic:
- Automatic start-stop and frequency conversion control to maintain stable water production;
- Automatic flushing and CIP triggering conditions (based on pressure difference, conductivity, or water production threshold);
- Alarm and remote monitoring (SCADA). Label all measurement points and automation interfaces with symbols on the flowchart to facilitate wiring and debugging.
CIP Process and Process Diagram
Annotations CIP is a conventional method for restoring membrane flux, and commonly used cleaning agents include acids (to remove alkaline scaling), alkalis (to remove organic/biological pollution), and specialized degreasers. The flowchart should include:
- CIP tank and chemical dosing pump;
- Switching valve for cleaning circuit (isolating production flow from cleaning flow);
- Clean the circulation path, discharge outlet, and neutralization tank. Example cleaning steps: pre-rinse → alkali wash (50–60°C) → rinse → acid wash → rinse → disinfect; all chemical concentrations, times, and temperatures need to be adjusted according to the membrane manufacturer’s recommendations and the type of contamination.
Ro Plant Design and Key Operating Parameters
| Parameter Category | Typical Range | Optimization Suggestions |
|---|---|---|
| Recovery rate | 50–75% for household systems, 70–80% for industrial systems | An excessively high recovery rate can easily lead to membrane fouling, necessitating a balance between water production and energy consumption |
| Tingkat desalinasi | Brackish water membrane 99.5%, seawater membrane 99.8% | Regularly monitor conductivity, and a decrease in desalination rate indicates the need for cleaning or replacing the membrane |
| Energy consumption | Power consumption per ton of water is 1–3 kW·h (depending on salinity) | Integrating an energy recovery device (such as a PX pressure exchanger) can reduce energy consumption by 30% |
| Membrane Lifespan | 2–5 years (depending on maintenance frequency) | Daily low-pressure flushing and chemical cleaning every 3–12 months can extend the lifespan |
Industrial Application and Customized Solutions
- High-purity water preparation (electronics/pharmaceutical industry):
- Employing a combined process of two-stage RO + EDI, the resistivity of the produced water can reach 18.2 MΩ·cm, meeting GMP standards.
- Seawater desalination:
- High-pressure RO membrane (operating pressure > 5.5 MPa) coupled with an energy recovery device, achieving a recovery rate of up to 40–50%.
- Wastewater reuse (electroplating/textile industry): The RO system removes heavy metal ions (such as nickel and chromium) to achieve wastewater recycling, with a recovery rate of over 95%.
Common Faults and Troubleshooting Process Based On of the Reverse Osmosis Plant Diagram
- Decreased water production and increased permeate conductivity: Suspected membrane fouling or damage. Check the inlet water pretreatment and SDI, perform flushing or CIP;
- Increased pressure difference across the membrane housing: This may indicate a blockage in the filter element or sand filter. Check the front-end filter and pressure gauge;
- The water quality of the produced water is inconsistent: check the calibration of the online conductivity meter, and ensure that the sampling point and valve position are correct;
- Frequent stopping and starting of the pump or vibration: check for cavitation, suction conditions, or mechanical wear. By annotating all valves and inspection points on the flowchart, we can quickly identify the source of the problem and reduce downtime. Maintenance cycle recommendations:
- Precision filter cartridge: Replace every 3 to 6 months.
- Activated carbon/resin: Replace every 10-12 months.
- Chemical cleaning of RO membrane: once every 3-12 months (depending on the inlet water quality).
Parameters And Calculation To Support The Reverse Osmosis Plant Process Design
- Recovery rate (Recovery) = permeate flow / feedwater flow. For household and drinking systems, it is usually controlled between 50–75%, while for seawater systems, it is much lower than that for freshwater systems.
- Membrane flux (Flux) = permeate flow rate / effective membrane area, unit: LMH (L/m2·h). During design, refer to the startup flux recommended by the membrane manufacturer and allow for a margin. The energy consumption per unit of water production (kWh/m3) is primarily determined by pump efficiency and operating pressure. The objective is to minimize transmembrane pressure and enhance energy recovery. These key formulas and design assumptions can be annotated next to the flowchart to facilitate project communication.
Environmental Protection and Compliance Considerations
- The discharge of concentrated water must comply with local emission standards, especially when it contains high salt content or specific pollutants, which may require secondary treatment;
- Chemical cleaning waste liquid should be neutralized and disposed of in accordance with hazardous waste management requirements;
- The documentation and flowcharts should include safety information and the location of the operation manual to meet audit and safety inspection requirements.
Practical drawing suggestions
- It is recommended to adopt a horizontal layout for the flowchart, with inputs on the left and outputs on the right, and to indicate the monitoring and control unit at the top or bottom;
- Use a unified symbol set (valves, pumps, filters, sensors) and include a legend;
- Two versions are provided: a concise version (for quick reference by operation and maintenance personnel) and a detailed version (for engineering design and construction purposes), both of which can be exported in SVG/PNG formats for easy sharing.
- Image Alt text example: Reverse Osmosis Plant Process Flow Diagram: A complete schematic from raw water, pretreatment, high-pressure pump, RO membrane module to permeate and concentrate paths.
Maintenance Plan and Recommendations Diagram Accompanied by SOP
- Daily: check valve positions, observe instruments, and record the flow and conductivity of produced water/concentrated water;
- Weekly inspection: clean the filter element housing, check the pump oil level and vibration, and verify the calibration status of the instruments;
- Monthly inspection: replace disposable fine filter elements, check valve sealing, and verify whether the recovery rate deviates from the design value;
- Annual inspection: membrane performance evaluation, arranging CIP or replacing membrane components when necessary, and comprehensive instrument calibration. Attach the SOP number and checklist next to the flowchart for easy on-site operation recording.
Kesimpulan
A clear diagram of the reverse osmosis plant can significantly enhance design communication efficiency, reduce commissioning time, and lower operation and maintenance difficulties. If you already have inlet water quality data (TDS, hardness, turbidity, temperature, etc.), we can assist you in drawing a customized flowchart and providing equipment selection recommendations. Please inform us of your specific needs and water quality data.
Get The Soluton Today!
